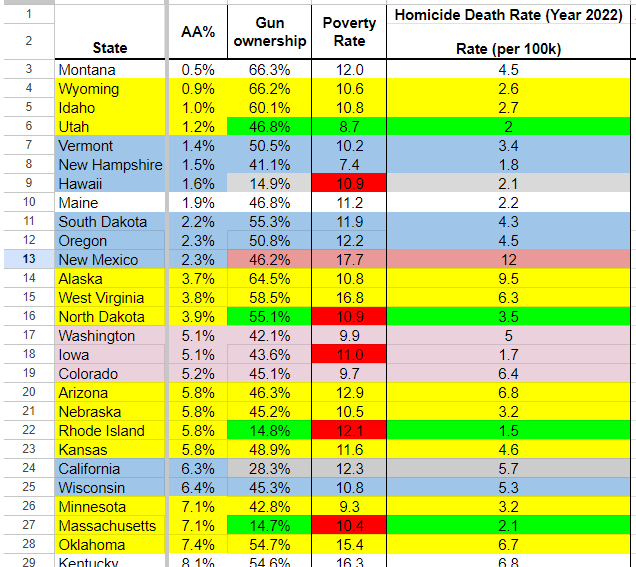
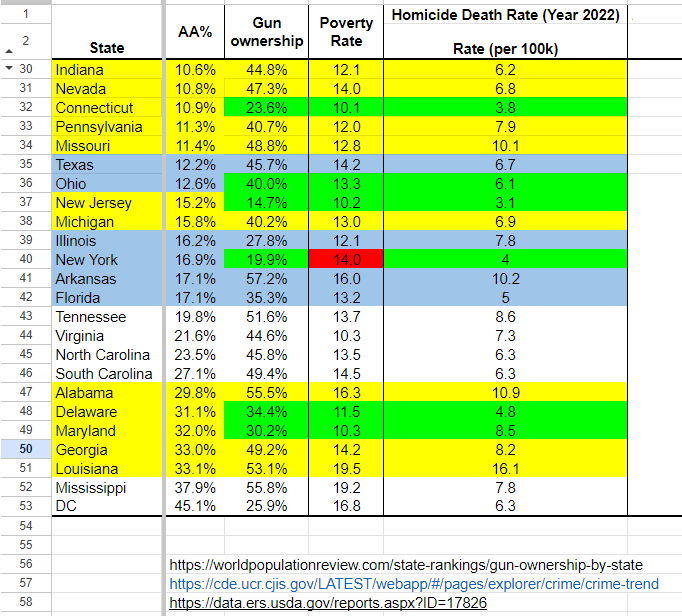
1. If data prior to 2019 is used, I believe it only strengthens my statement since, if you are right, the left tolerated the criminals since the pandemic and therefore made the blue states worse since most of the left are in blue states. And more blue states have lower gun ownership.
2. Poverty is more accurate/relevant than median household income since it's a better indicator of wealthy or poor. Median household income is just a number and has different buying power at different locations. A family with100k a year in one place can be pretty rich but is very poor in some other places like SF. 100k gives someone a pretty comfortable life so that he does not need to rely on getting money illegally, but with $100k in SF, you probably need to rely on stealing or robbing.
3. 故意忽视对你不利的分组? Which set of states did I 故意忽视?
jhe123 写了: 2024年 8月 27日 10:10
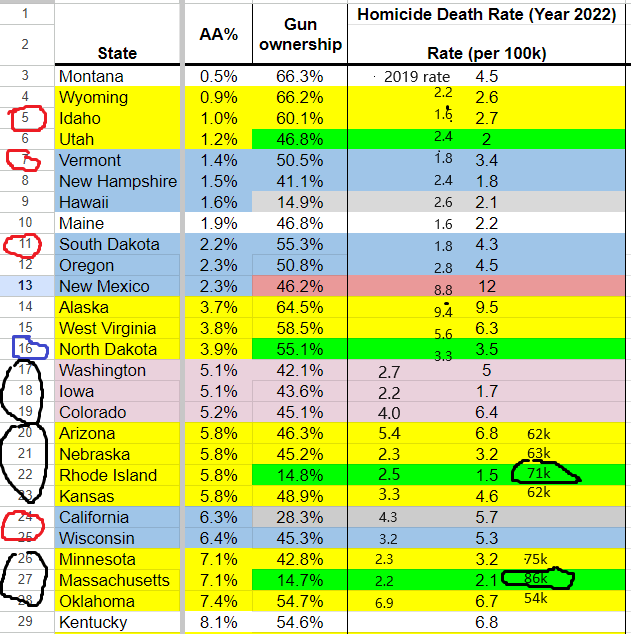
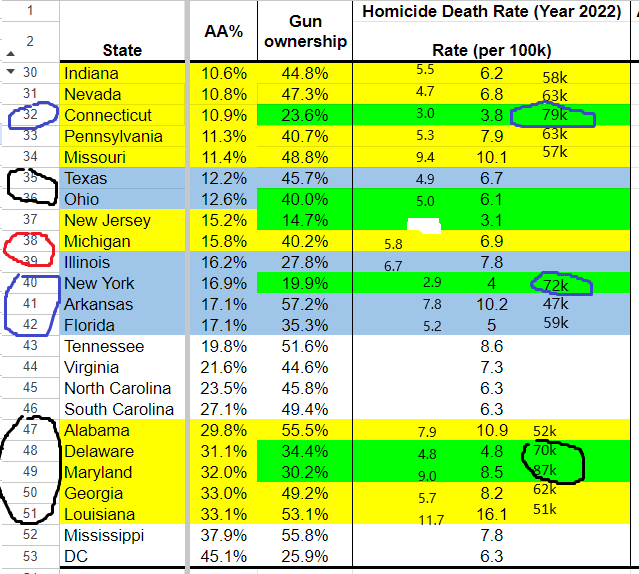
1. 谋杀率应该选2019年或者之前的,而不是22年的。疫情和极左放纵犯罪的影响让数据不能反映常态,就算极左以后放纵犯罪成了新常态,那也要再等几年才能看清楚新常态下的治安到底咋样。
2. 经济指标应该选median household income才能真实反应各州的经济水平。这里选贫困率是不合适的,尽管收入低的人群犯罪率会高,但其他人群也会犯罪,其次各州福利大不相同,所以就算都是贫困人口,各州的生活境况也可以相差很大,这个差别对犯罪的影响不容忽视。NY,MA,CA是福利最好的几个州,而它们能这么做的原因是整体经济好才负担得起。
3. 虽然我认为你这种强制按AA%分组的做法是不正确的,但即使退一步由着你这么做,你分组的时候也请尽量客观些,不要故意忽视对你不利的分组,LOL。。。